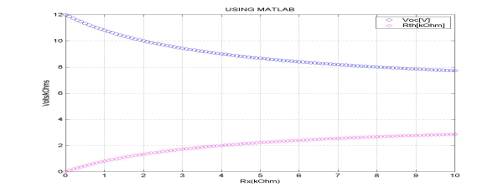
LEARNING EXAMPLE

Using MATLAB to generate and
plot data


DATA TO BE PLOTTED
» Rx=[0:0.1:10]'; %define
the range of resistors to use
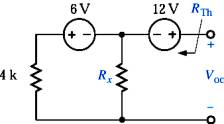
» Voc=12-6*Rx./(Rx+4); %the
formula for Voc. Notice "./"
» Rth=4*Rx./(4+Rx);
%formula for Thevenin resistance.
» plot(Rx,Voc,'bo',
Rx,Rth,'md')
» title('USING MATLAB'),
%proper graphing tools
» grid, xlabel('Rx(kOhm)'),
ylabel('Volts/kOhms')
»
legend('Voc[V]','Rth[kOhm]')