%pulse1.m
%
displays the response to a pulse response
tmin=linspace(-0.5,0,50); %negative
time segment
t1=linspace(0,0.5,50); %first
segment
t2=linspace(0.5, 1.5,100); %second
segment
vomin=12*ones(size(tmin));
vo1=12*exp(-t1/0.2); %after
first switching
vo2=12-11.015*exp(-(t2-0.5)/0.2);
%after
second switching
plot(tmin,vomin,'bo',t1,vo1,'rx',t2,vo2,'md'),grid
title('OUTPUT
VOLTAGE'),
xlabel('t(s)'),ylabel('Vo(V)')
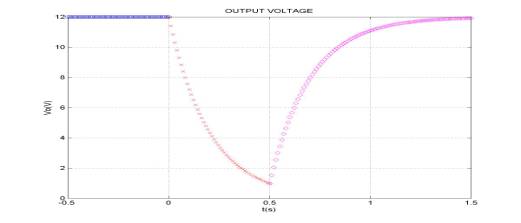

USING MATLAB TO DISPLAY OUTPUT VOLTAGE

