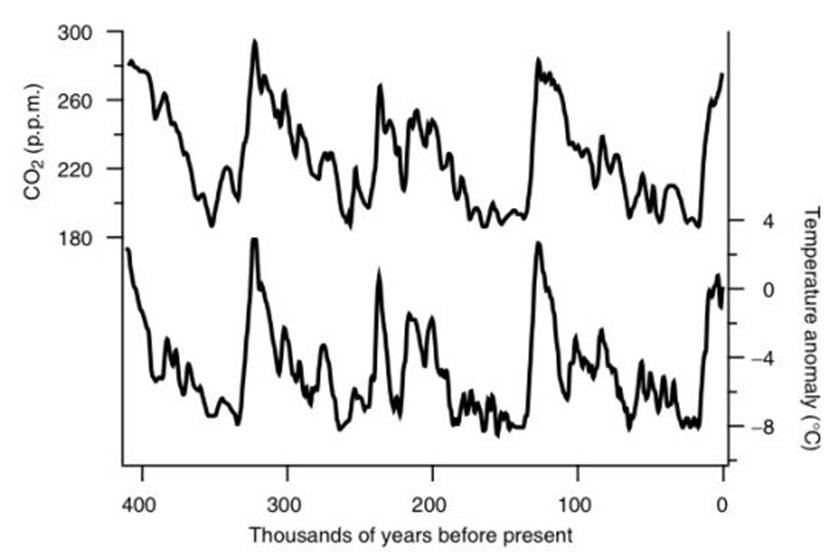
FIGURE: Data from the Vostok ice core in Antarctica, from 410,000 years ago
to the present. The top curve shows abundance of CO2 (in parts per million)
from air bubbles in the ice core. The bottom curve shows the temperature
anomaly in the Antarctic region, relative to the present, from isotopic
measurements of the ice. After Fig. 3-6 of
The Science and
Politics of Global Climate Change: A Guide to the debate (Cambridge Univ.
Press, 2006)